Long-distance work and domestic offshoring
March 07, 2024


In 2020, the Covid-19 pandemic ushered in an unprecedented new era of remote work. Despite some institutional backtracking as health concerns have abated, remote work remains far more prevalent and acceptable today than it once was.1As of mid-2023, 28.1 percent of workdays across all lines of work (including those impossible to perform remotely) were worked at home. That figure was down from a peak of 61.5 percent at the onset of the COVID-19 pandemic, but up from a mere 7.2 percent immediately before the pandemic. See Figure 1 of Barrero, José María, Nicholas Bloom, and Steven J. Davis. “The evolution of work from home.” Journal of Economic Perspectives 37.4 (2023): 23-49.
That’s given employers access to a broader labor market and new options for configuring their talent pool—and its price tag. That is true whether the work is performed from a couch or from a satellite office.
Remote work eases access to new labor markets because it means the satellite office is no longer a prerequisite for employing workers in faraway places.2While the technology that enables remote work is recent and necessary for it, it was available before the pandemic. Rather, it was the coordinated mass shift into prevalent remote work and the consequent social acceptability of it that were the most consequential impacts of the pandemic in this context. It also creates opportunities for workers to take their existing jobs elsewhere or take on work that once would have meant relocation.
In a prelude to this study, we used ADP data to show that the prevalence of long distance or cross-metro work—a close cousin of remote work—has skyrocketed since early 2020. In this study, we turn our attention to the proliferation of new employment connections between America’s cities. We look at the nature of those connections through the lens of company reporting structures, separately examining the location of workers and their managers.
One might expect remote work to level the playing field between places, but, perhaps counterintuitively, the mitigation of distance as a barrier to employment has accentuated some existing differences.
Working out of one metro and into another
To study employment connections between places, we need to know where workers are and where jobs are. Unfortunately, the location of remote jobs isn’t always well defined. We use ADP data on the reporting structures of large employers to pin each employment relationship to the worker’s metro of residence on one end and their manager’s on the other.3The sample used consists of a subset of employers in ADP data with at least 1,000 employees in the U.S. Within those employers, the sample was further limited to members of teams with a reliable set of reporting structure fields by limiting the data to teams in the U.S. in which no more than 10 employees report to the same manager. Although the number varies over time, there are approximately 1.33 million employees that meet these criteria each month on average from January 2016 to June 2023, employed by an average of 3,500 firms each month.4While the location of a job is well-defined when someone attends it regularly in person, it can become conceptually unclear in the context of remote work, especially when a job is remote from the start. When the worker lives in a different metro than their manager, we call this long-distance work or, more analytically, cross-metro work out of the worker’s metro and into the manager’s. Those out- and in-bound relationships form the basis for this study.
We refer to metro areas that have more workers reporting into them than reporting out to managers elsewhere as leadership hubs, and to those with fewer in-bound than out-bound workers as workforce nodes. Each metro area’s place on the spectrum can be captured by a single number, its net leadership ratio, which divides the number of in-bound workers by the number of out-bound ones. A ratio greater than 1 indicates that a metro specializes in managerial tasks. A ratio of less than 1 indicates specialization in individual or frontline work.
Larger cities have long been net leadership hubs
Figure 1 shows the net leadership ratios of U.S. metros with populations of 250,000 or more.5Metropolitan areas refer to Consolidated Statistical Areas (CSAs) where applicable and Core-Based Statistical Areas (CBSAs) elsewhere. By using the broadest available definitions of metropolitan areas, we minimize situations in which workers separated by arbitrary lines within broader metros, e.g. between the San Francisco and San Jose metro areas, are considered cross-metro. This downside of this approach is that the largest metro areas internalize employment relationships that are cross-metro in kind.6The sample is limited to metros with 250,000 residents or more, as observed in the 2017-2021 5-year compilation of the U.S. Census American Community Survey. Smaller places are omitted because their information is likely to be less reliable given the sample’s coverage of workers.
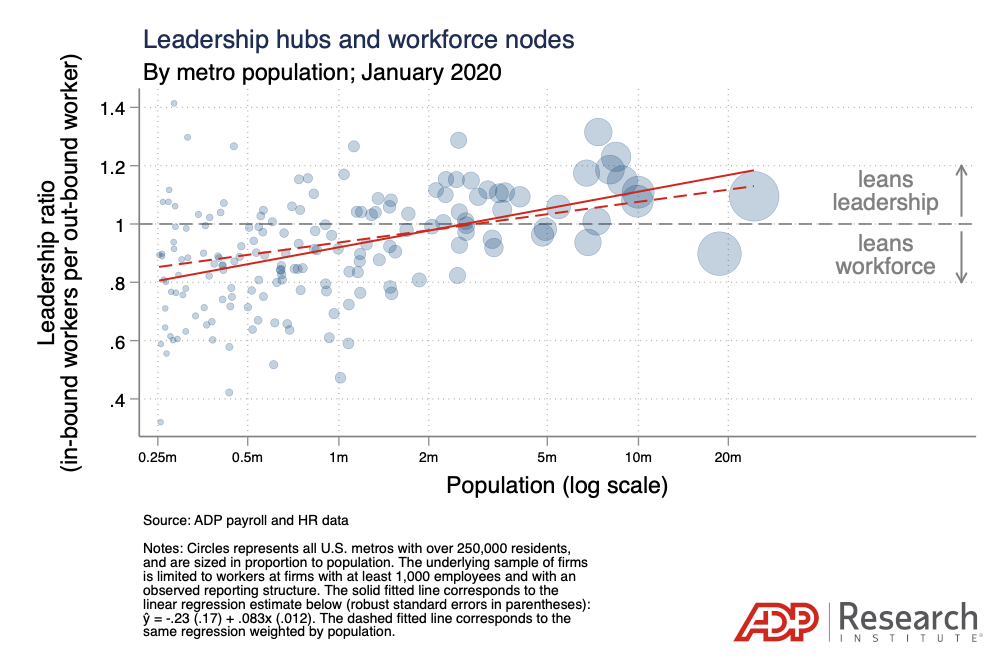
Large cities tend to have higher leadership ratios than small ones, as highlighted by the fitted lines which capture the average relationship between net leadership ratios and metro size.7Two variants of fitted lines are shown, with and without weighting the fit by metro area population. The results yielded by both variants are consistent with one another throughout the study. That’s not surprising, and it’s consistent with the intuition that larger cities play a more central role in the economy. The relationship is clearest when metros of all sizes are pooled together, but it holds when the pool of metros is limited to those with populations greater than 1 million.8The regression using the sample of all U.S. metros with between 250,000 and 1 million residents yields ŷ = -0.23 (0.17) + 0.083x (0.012), with robust standard errors in parentheses. Limiting the sample to metros with more than 1 million residents yields ŷ = -0.27 (0.43) + 0.086x (0.028).9Cities with more expensive housing tend to have higher leadership ratios on average as well. However, this relationship is driven entirely by smaller metro areas with populations between 250,000 and 1 million. Among metros with more than 1 million residents, leadership ratios are positively correlated with population but not with typical home values, whereas for those with a population of between 250,000 and 1 million, they are positively correlated with typical home values but not with population.
Remote work has raised the leadership ratios of the most expensive cities
The data so far offers a snapshot of leadership ratios by metro as of January 2020, just before the pandemic upended life in the United States. The important question, however, is what the proliferation of remote work has changed since then.
In the years immediately before the pandemic, net leadership ratios didn’t change, on average. Changes that did occur didn’t vary systematically with city size or housing prices.
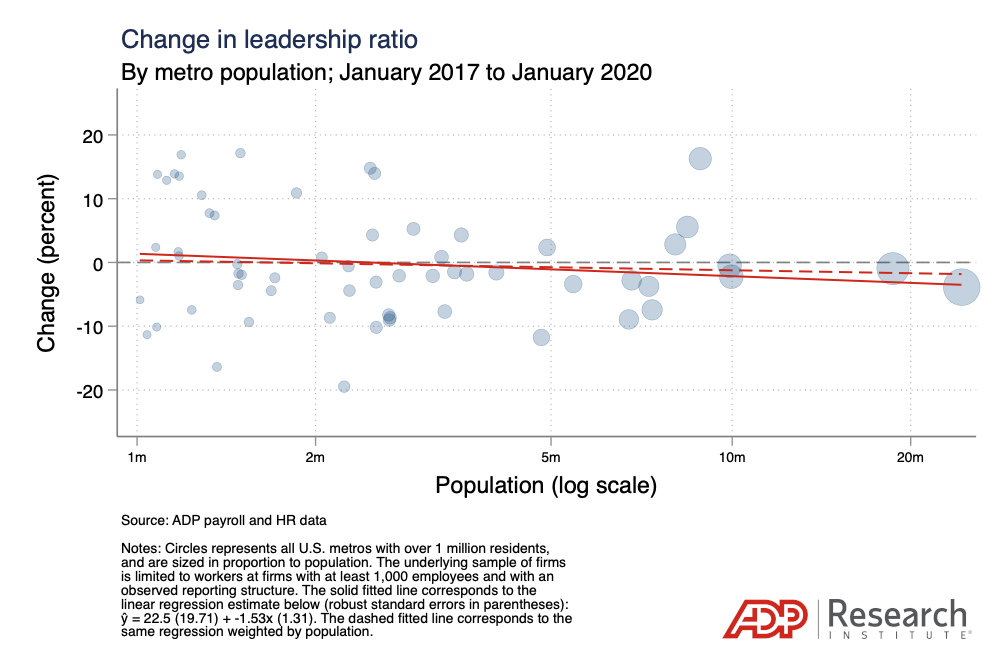
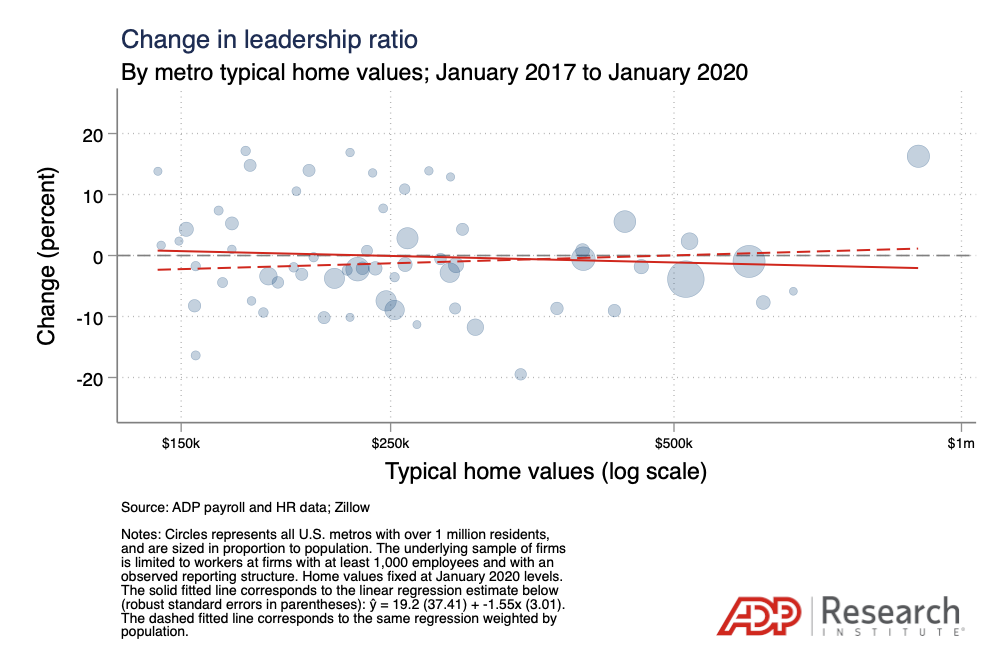
Figures 2a and 2b show the change in net leadership ratios for metros with at least 1 million residents from January 2017 to January 2020.10The analysis of changes in metro leadership ratios is less tolerant to data limitations than the analysis of their levels. Because the sample of employers with observed reporting structures is more limited in smaller metro areas, the remainder of the analysis is limited to metros with at least 1 million residents. Figure 2a plots those changes against population, while Figure 2b plots them against typical metro home values.11Because the Zillow Home Value Index (ZHVI) is reported for CBSAs but not CSAs, the log typical home values used are a housing-unit-weighted average of each metro area’s constituent counties’ ZHVI. Throughout the study, the typical home values associated with each metro area were drawn from a single point in time (January 2020, just prior to the pandemic). They were kept static in this way to avoid housing price appreciation from influencing results. The fitted lines capture the average relationship with population and home values. In both cases they’re close to zero and essentially flat.
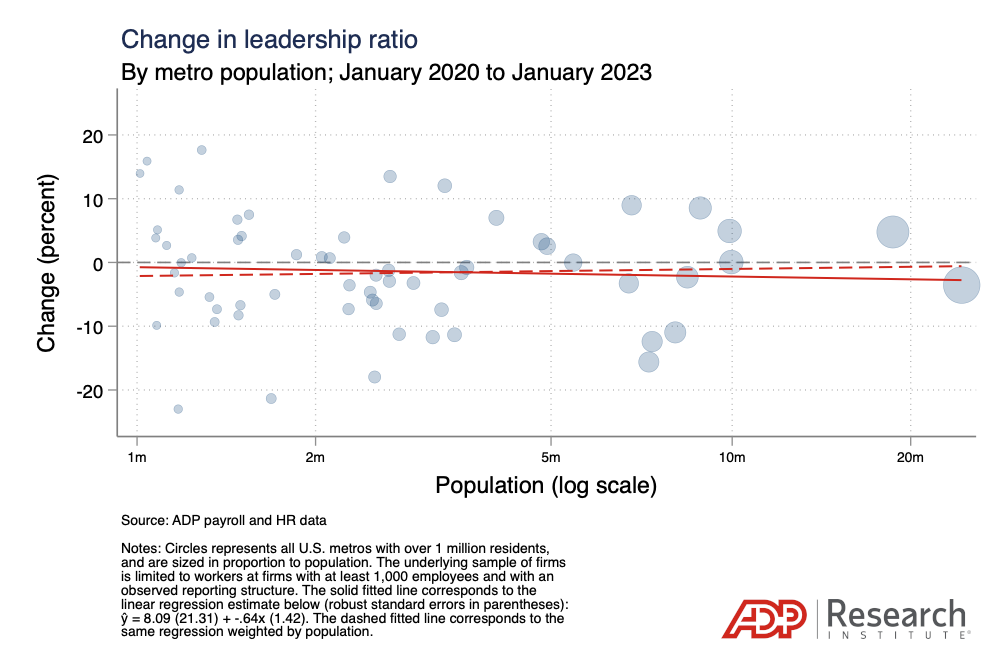
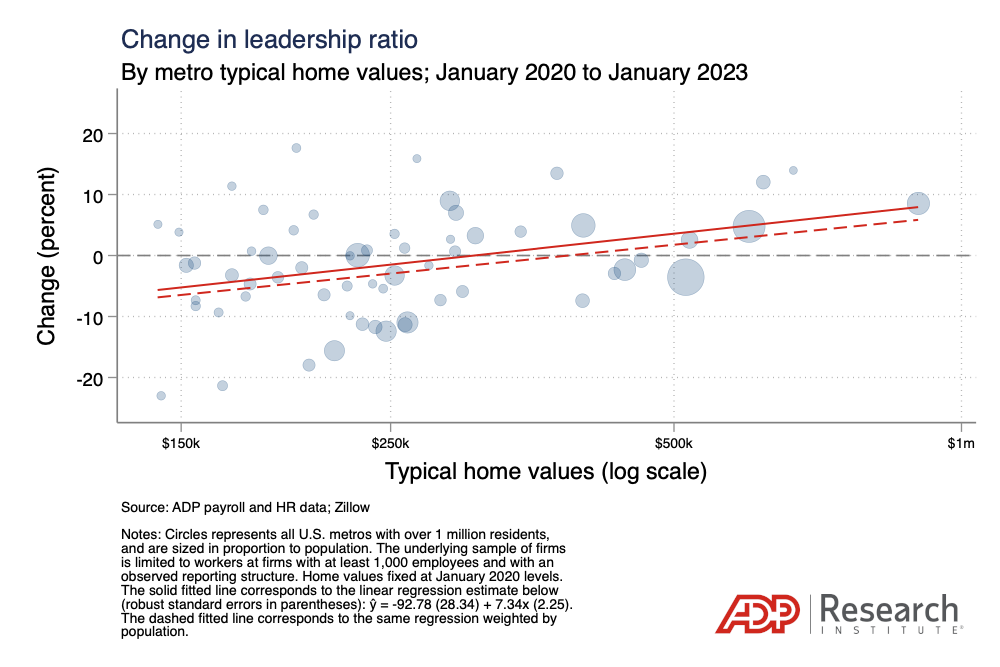
Things changed with the rise of remote work. Figures 3a and 3b repeat the same exercise for January 2020 to January 2023. The relationship between the change in metro leadership ratios and population remained flat during the later period, but the relationship with home values turned significantly positive.
That means more expensive cities have, on average, become increasingly more specialized in managerial tasks since the onset of the pandemic, while more affordable ones have become increasingly more specialized in individual contributor and frontline work.
How much so? Suppose home values in one city are about twice as high as those in another. While leadership ratios for both cities would have fared similarly before the pandemic, the more expensive city’s ratio would have increased by about 5 percent more in the three-year period since. Leadership hubs have ratios of around 1.2 (Fig. 1), which means a 5 percent increase to 1.26 over three years is rapid and meaningful, especially if it continues to compound over time.
Domestic offshoring, turbocharged
The shift to prevalent remote work has rendered expensive cities increasingly management-heavy, while rank-and-file workers locate elsewhere.
That suggests that the rising leadership ratios of America’s most expensive metros are an invigorated extension of a longstanding pattern of domestic offshoring: The increasing ease with which workers can collaborate from distant places has shifted low-paying work to more affordable places and concentrated value-intensive jobs in expensive ones. That sorting—which began long before the pandemic—has been enabled by technology and propelled by the yawning gap in housing costs between America’s priciest cities and its more affordable ones.
What is keeping leadership concentrated in the expensive cities? Those cities have one big advantage: They enable decision-makers to interact with each other in ways that benefit from established in-person relationships precisely because those leaders are concentrated there. Headquarters, elite universities, research facilities, think tanks, clients, regulators, competitors, and the media all are disproportionately located in leadership hubs. A manager who is not ever-present in the right circles in those hubs will be challenged to develop the personal rapport and familiarity upon which influential decisions depend. Video conferencing and even frequent visits to a leadership hub are a poor substitute, especially when the stakes are at their highest.
For individual and frontline work, the stakes tend to be lower, making those jobs easier to perform remotely. Employers, therefore, have an incentive to locate those workers in places that are more affordable. Companies weigh the wage advantage of locating jobs in more affordable places against the frictions introduced by long-distance work, frictions that tend to be substantially greater for more influential roles.
By mitigating distance as a barrier to employment—much more so for rank-and-file workers than for managers—prevalent remote work is turbocharging the process of domestic offshoring from expensive leadership hubs to more affordable workforce nodes. In this sense, remote work is accentuating existing differences between metros.
Interconnectivity between cities is exploding
In addition to its role as a catalyst of domestic offshoring, the proliferation of remote work is also boosting employment interconnectivity between U.S. cities.
That means that the share of employment relationships that cross metro lines is exploding. In almost every city, a growing share of workers are reporting to managers located elsewhere, and managers in almost every city are responsible for workers who are located elsewhere in greater numbers.
Despite the growing leadership ratios in the most expensive cities, these urban centers also are seeing growth in the share of both in- and out-bound work, as are nearly all other cities.
How do we measure employment interconnectivity between cities? “Out-bound workers” describe people who are situated in one place and report to a manager who is situated somewhere else. “In-bound workers” are measured from the point of view of managers, a label that describes direct reports who live outside the manager’s metro. To measure a metro’s interconnectivity, we look at the share of a metro’s resident workers who are out-bound, and at the in-bound share among those reporting to managers in the metro.
Figure 4 shows the distribution across metros of the growth in each metro’s share of out- and in-bound workers, before and after the onset of the pandemic. The left panel indicates that, for the median metro, the out- and in-bound share of workers grew by 2.4 percent and 4.0 percent, respectively, from January 2017 to January 2020.
From January 2020 to January 2023, the ranks of remote workers grew by 31.3 percent and 35.0 percent—about 10 times faster. While the distribution included some metros whose share of out- and in-bound workers shrank before the pandemic, at least 90 percent of metros saw those shares increase after the pandemic.
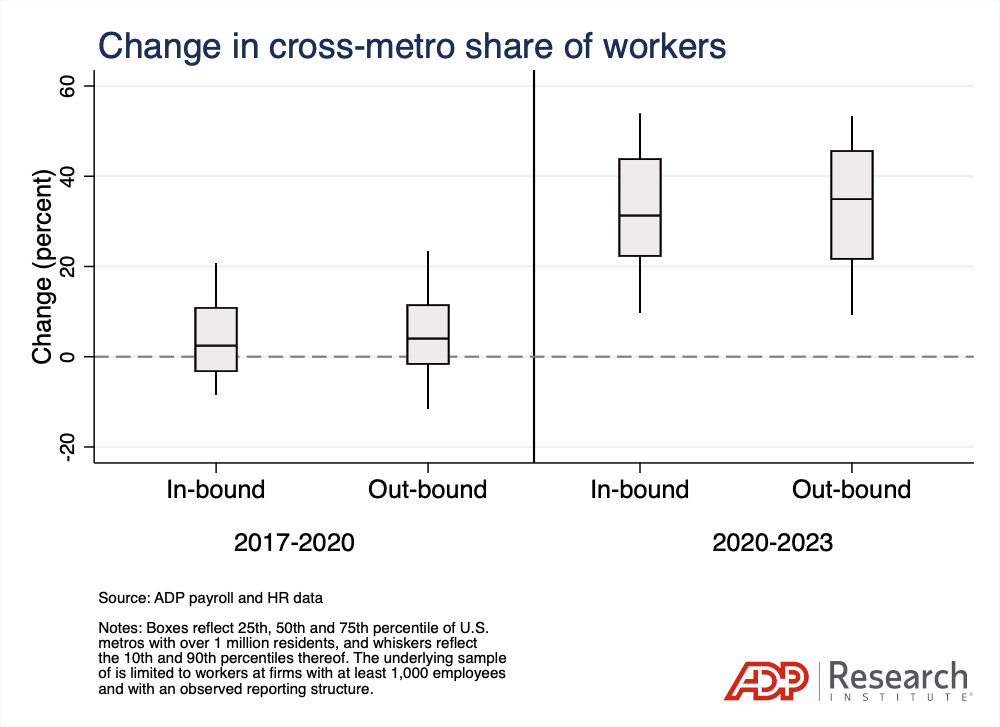
In other words, before the pandemic, long-distance work was growing gradually, but since then it has been growing far more rapidly in almost every city. Even in expensive places like San Francisco and New York, a sizable share of workers reports to managers elsewhere.
The unprecedented growth of interconnectivity between cities is more than a statistic. It corresponds to new norms in the organization of work. There is now much less need to concentrate members of a team near the same office, and online communication increasingly is default way that work is done, even in on-site settings.
A new type of compensation strategy
The implications do not end with how meetings are managed.
The new world of distributed work means that employers in many instances no longer need to tie a job to a single place. A labor pool unbound by location offers the potential to lower labor costs while improving the fit between employers and candidates.
But even that’s just part of the story. When an employer ties a job to a place, it also determines the experience that job can offer employees. Will the job require workers to live far from their families, make new friends, and adapt to a different climate or culture?
In this new age of location-agnostic work, employers can grant employees the flexibility to choose the location that best suits their needs, wants, and circumstances. It’s not just about hiring in cheaper places, but about offering workers the optionality that they covet. What do employers get in return? The potential to reduce labor costs even in expensive places, while raising their appeal to talent.
For more on this thread, stay tuned for the next installment in this series.
