2019 State of the Workforce Report
More from this research


Executive Summary
Summary of findings for the 2019 State of the Workforce Report
April 16, 2019
|
 4 min
4 min


The first annual State of the Workforce Report provides decision makers with organizational benchmarks to compare against their own internal HR statistics.
National Averages
The National Summary Statistics section provides a high-level overview of HR metrics at the national level, inclusive of all industries and all firm sizes (of at least 50 employees). 
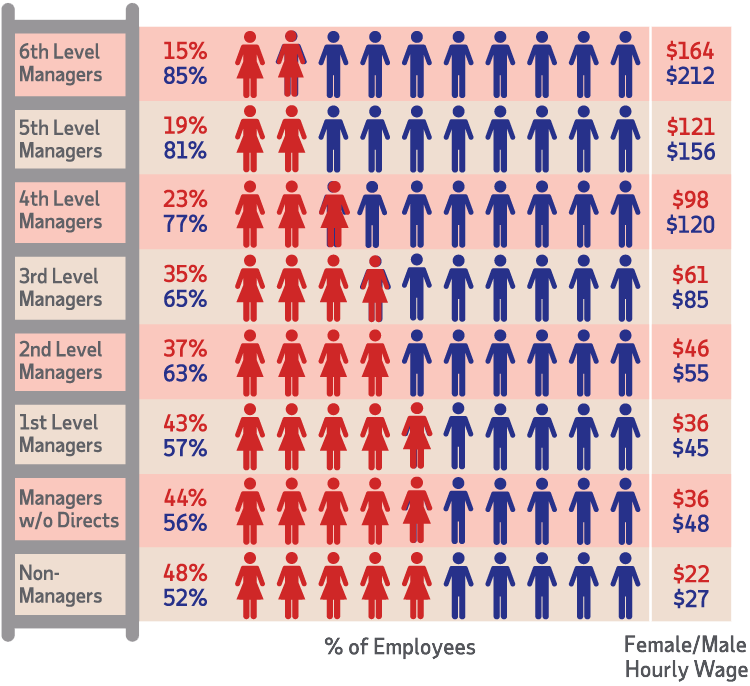
Males and females show significant disparities across pay and organizational hierarchies
Gender differences across hierarchy levels show that the proportion of women in senior level positions is significantly lower than that of men. This pattern was evident across all industries and intensifies up the corporate ladder. A “glass ceiling” was evident at the 4th hierarchy level which showed the steepest decline in the representation of women across the levels.
Span of control is marginally correlated with turnover and promotions
Report data show that firms with high average spans of control in some industries generally exhibit slightly lower promotion rates and higher turnover rates compared to firms with low spans of control. Different industry sectors within the U.S. economy face different types of market conditions, growth rates and consumption of resources. As a result, the organizational metrics within each industry sector follow distinctive patterns. 
Firms are more likely to promote internal employees for management positions
A comparison of promotion rates over a one-year period against the proportion of new hires reveals that firms are more confident in promoting from within versus hiring externally for management positions. At the supervisory levels, firms promoted more internally than they hired externally—17.2 percent of managers are promoted, while 15.6 percent are new hires. The disparity becomes even more apparent at the highest rankings within an organization, where 21.5 percent were internally promoted and only 12.5 percent were new hires.

Promotions within a team are associated with higher turnover among other team members
The effect of promotions on turnover within teams of three or more employees was analyzed. The data show that teams in which an employee was promoted had higher turnover when compared to teams where no promotions occurred. Teams where a promotion occurred showed a turnover rate of 13.3 percent, while teams without a promotion had 12.3 percent turnover.

Employee turnover varies significantly with demographic factors
Monthly turnover rates for older employees are relatively lower compared to younger age groups. The overall turnover rate for those aged 65+ was 2.2 percent, while turnover successively increases across younger age groups to 8.0 percent for those aged 25 years or less. The turnover rates were very similar across genders, with males leaving their jobs at a rate of 3.0 percent per month and females at 3.5 percent per month overall.

